Single Family Home Sales Statistics
Land Sales Statistics
Overall Market View
No Extraordinary Sales Expected
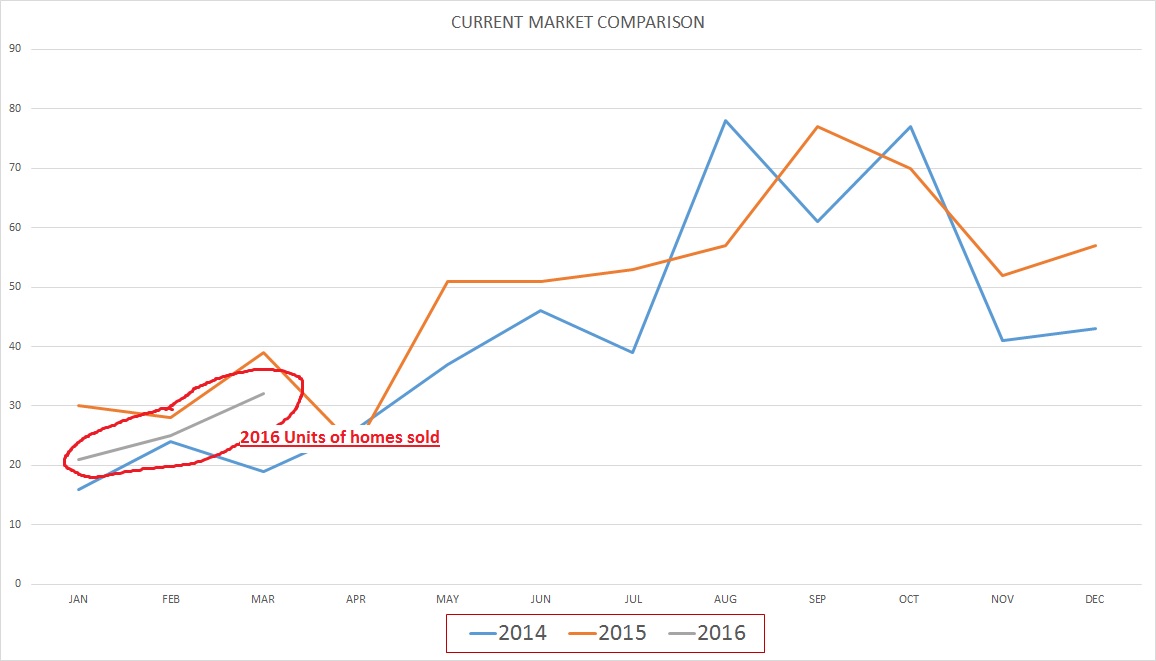
While the Highlands/Cashiers area real estate market is coming back into its busy season, statistics show the market as status-quo. In layering the sales data from 2014 until March of 2016, we see no major changes in the market. In fact, we see 2016 starting a little slower than 2015. What does this mean?
For Buyers, this is still a great time to buy a home in the mountains. It also means that buyers are in the drivers seat.
For Sellers, it means that expectations to sell their home should not be set too high. High expectations can result in homes staying on the market for longer periods of time (DOM or Days On Market).

HOW CAN I GET MY HOME SOLD?
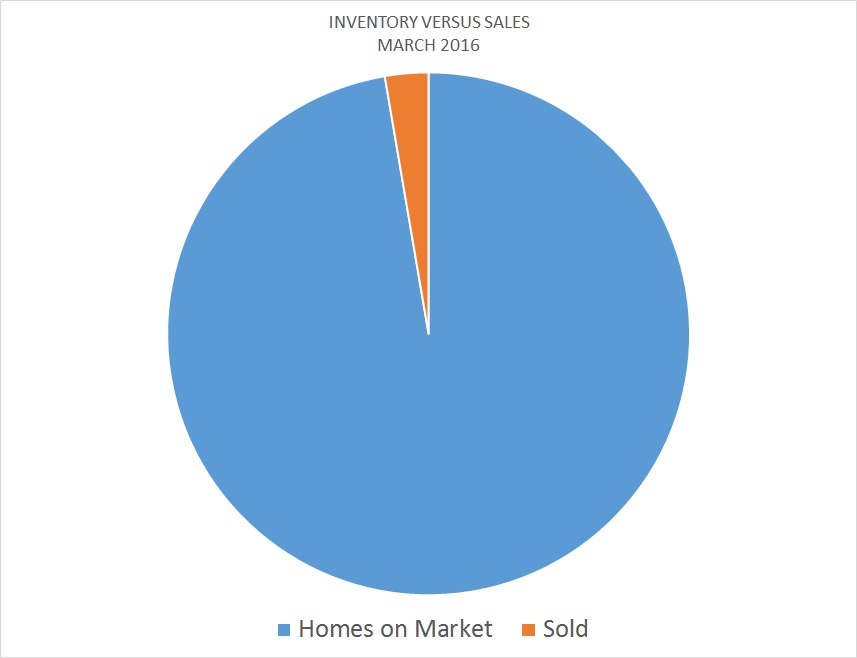
Be reasonable. Look at the chart below. This shows the number of homes sold in March 2016 as compared to the inventory available. You might say, the blue area is your competition.

Now realize that the ORANGE SLIVER represents the 32 homes that did sell. So, divide the ORANGE SLIVER into 32 equal pieces. That one small section you end up with of the 32 is equal to your home. So, how do you compete? How do you plan to get your home sold?
Believe it or not, your Broker wants the same thing you do; To sell your home for the most money they can get. However, your Broker is in the best position to tell you what the Market is doing. They watch the Market continually to offer you advise. While it is true you may “feel” your property is worth more or that you may have paid more for it or put a lot improvements into it, COST ≠ VALUE (Cost does not equal Value).
Be “IN” the Market, Not “On” the Market
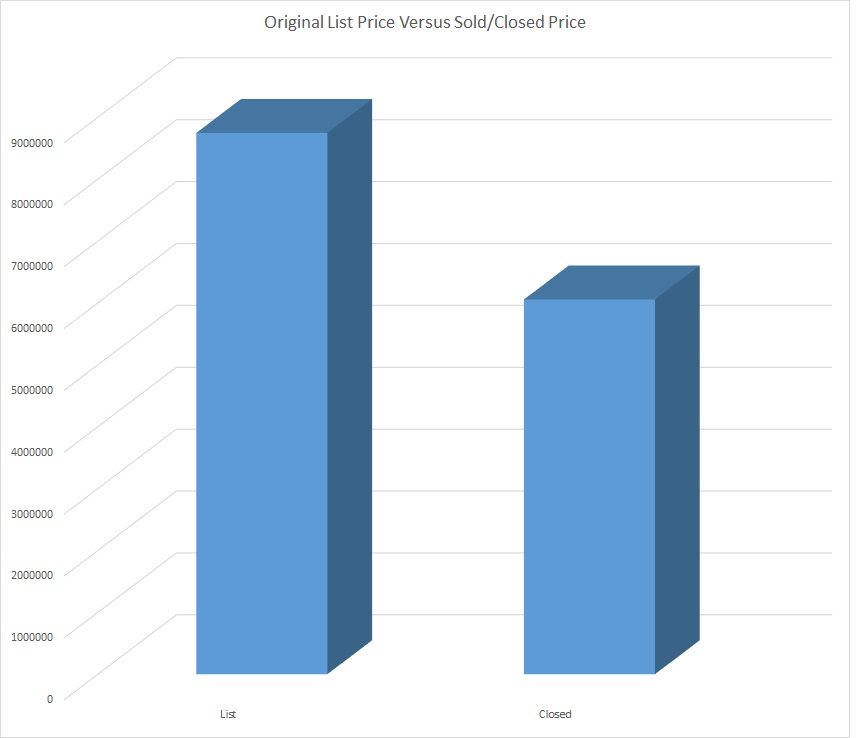
While Market Data will state that homes sold for 90% of there List price, this does not paint a real picture. This percentage is based upon the List price at the time it sold. In reviewing the “Original” List price, we find these homes sold for about 69% of the “Original” list price. Take a look at this graph to see what that looks like:

After many Days On Market (DOM) Sellers were forced to reduce their prices to get their homes sold. The mentality of many is, “The buyers are going to beat us up on price, so we’re going to price high so we can give a little,” is not a good strategy. Why not?
If you are overpriced, buyers are not going to look at your property. They will go look at properties that are closer to their budget. For example, if you’re priced at $495,000, buyers looking in the $400,000 – $450,000 range may never see your listing. If your home is not “In the Market” for what they are looking for, you are overpriced. The competition for the Market is tough and you have to be priced right to sell. Buyers know the market and they simple will not consider properties that are priced to high.
If you’re not getting many views on your home, chances are good you are priced too high. If you want your home sold during this upcoming selling season, you need to develop a strategy now.
RECENT HOME SALES (MARCH 2016):
Total homes listed in Highlands/Cashiers MLS: 1159 – This number is expected to rise as many Sellers desire to take advantage of the selling season. This number is expected to rise to around 1500.
Homes Sold This Month: 32-Less than the 2015 model, as seen in chart at top.
Average Sales per Month 1 Year Average: 47 (Unchanged)
Inventory: 24 months – This is determined using the Average Sales Per Month, as this market is very seasonal. Remember, a healthy market inventory is considered to be 6 months or less.
DOM: 533
Average DOM (YOY): 460
Median Sales Price: $243,500– This is a more significant number than “Average Selling Price.” This helps us to see where the middle of the market is selling.
Average List/Sell Ratio: 90.03% -Take into consideration this is not the “Original” List Price, as mentioned earlier. This continues to show that homes are overpriced. Sellers need to be aggressive in pricing to stir competition for their home. Pricing aggressively is what creates more lookers and more offers.
Synopsis: As we are coming into our Selling Season, Sellers should want to take advantage and be aggressive. As we go further into the season, if there is a lack of lookers, Sellers should want to consider their pricing and adjust accordingly before the season wanes.
RECENT LAND SALES (MARCH 2016)
Land Units Sold: 8
Total listed in all MLS: 1188-This number should continue to increase, which is not good for Sellers.
Inventory: 84 months. That’s 7 years of inventory. Some sellers have given their land away if the buyer covered the closing fee’s. Land is moving, but there is no real demand.
Synopsis: No demand means prices for land remain very low, compared to former pricing.
Overall Market View:
31% of home sales ranged from $200,000 to $499,999. This is the major portion of market sales.
15% of home sales ranged from $500,000 – $749,999. This was a significant rise in homes in this price range.
12% of sales were above $1,000,000. Unchanged.
Sellers, you should not expect top dollar for your home. If this is what you desire, you may want to remove your home from the market, temporarily.
Buyers, as we head into our busy season, good buys don’t last long. You need to be on top of any listings that pique your interest and be ready to move on them.
If you’re considering listing your home for sale or purchasing a home in NC, please feel free to contact a local agent or REALTOR®. They will make a specific report for your area of our MLS (Sapphire, Norton, Glenville, Highlands, Toxaway, Clear Creek, Breedlove, etc). You can then make an informed decision on how to sell or buy your home.
